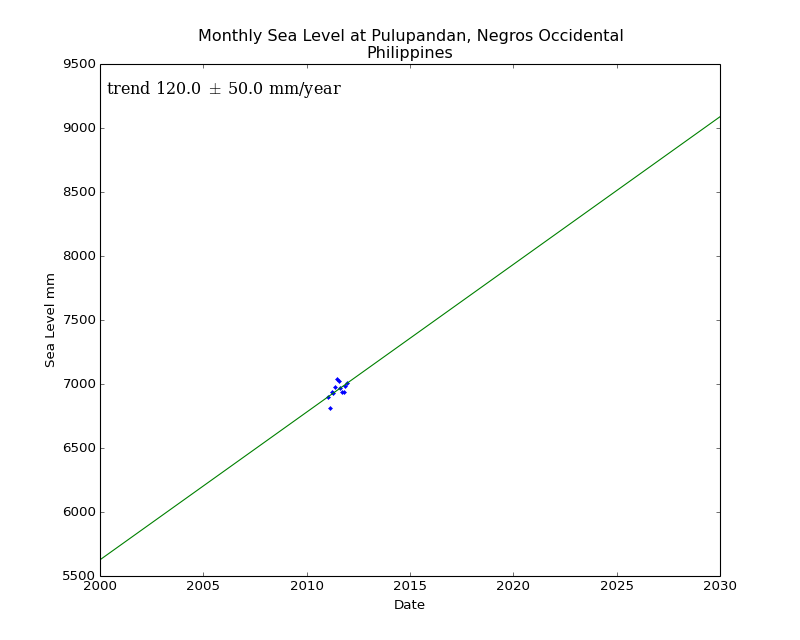
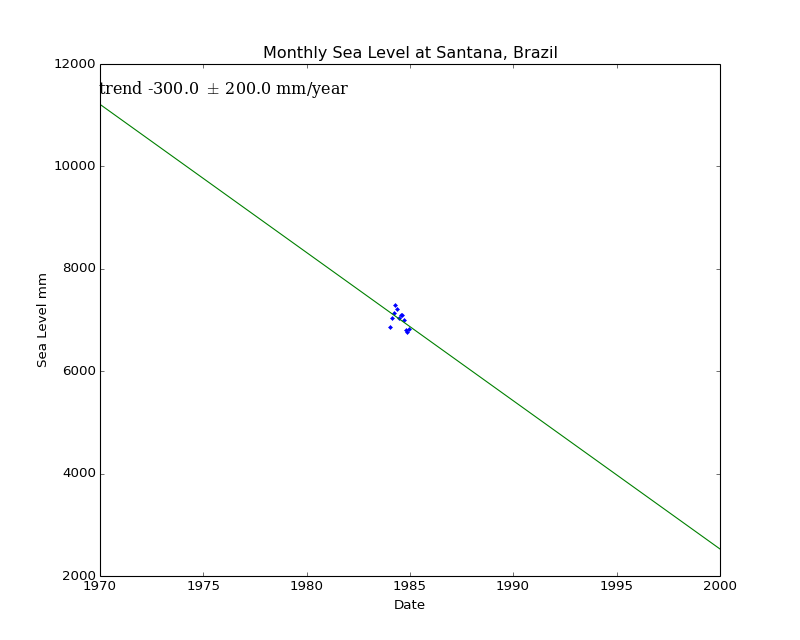
PSMSL holds global tide gauge data. For a tide gauge PSMSL show graphs of sea level but not the rate of sea level rise. So I’ve done it.
There are more than 1400 tide gauges so I’ve put the results on JeremyShiers.com which shows a table of
- tide gauge location
- years in operation
- rate of sea level rise/fall
Note tide gauge observations will be affected by rising or falling land, neither PSMSL or I have taken account of this. The tables and graphs presented here are a first step. Next would be to look at the description of each site at PSMSL, then maybe a site visit or investigation into land movement.
The following histogram shows
- rates of sea level rise can be negative as well as positive
- older tide gauges have smaller rates of rise/fall
There are a few tide gauges which only have a single year of observations. These may show a large rise
or a large fall
1142 out of 1418 tide gauges (just over 80%) have less than 60 years of observations.
Here is the histogram of rate of sea level rise/fall for those with more than 60 years.
 The average rate of sea level rise is 0.6 ± 0.2 mm/year.
In contrast there are 723 tide gauges which have observations for more than 30 years, for these the average rate of sea level rise is 1.2 ± 0.3 mm/year.
IPCC claim the global rate of sea level rise jumped to over 3mm/year in 1993, coincidentally when satellites measuring sea levels were launched.
It should be obvious satellites and tide gauges are not measuring the same thing as
- Tide gauges measure sea levels at the coast, usually near a port
- Satellites measure (or attempt to measure) sea levels across the world’s oceans.
Satellite sea level measurements depend crucially on knowing where the satellite is.
The guys behind GRASP(Geodetic Reference Antenna In Space) clearly think there is a problem as they’re proposing another satellite to sort out this ‘problem’. Their proposal explicitly states global tide gauge measurements of sea level rise are in the range 1.2 to 1.6 mm/year. Satellite measurements are supposed to be around 3mm/year.
The tide gauge with longest record is Brest, no sign of 3mm/year rise there.
The longest tide gauge record in Britain is from Sheerness, though sadly therae a long gaps around 50 years!
The observations shown by PSMSL are adjusted, in part to account for relocation of tide gauges which can end up in the tide gauge being in a different position vertically. Here is the unadjusted Sheerness data.
 Clearly there is the possibility of affecting the rate of sea level rise during this adjustment process.
Here is the unadjusted data for Felixstowe
and the adjusted.
 how come 1920 to 1980 didn’t make it to the adjusted data?
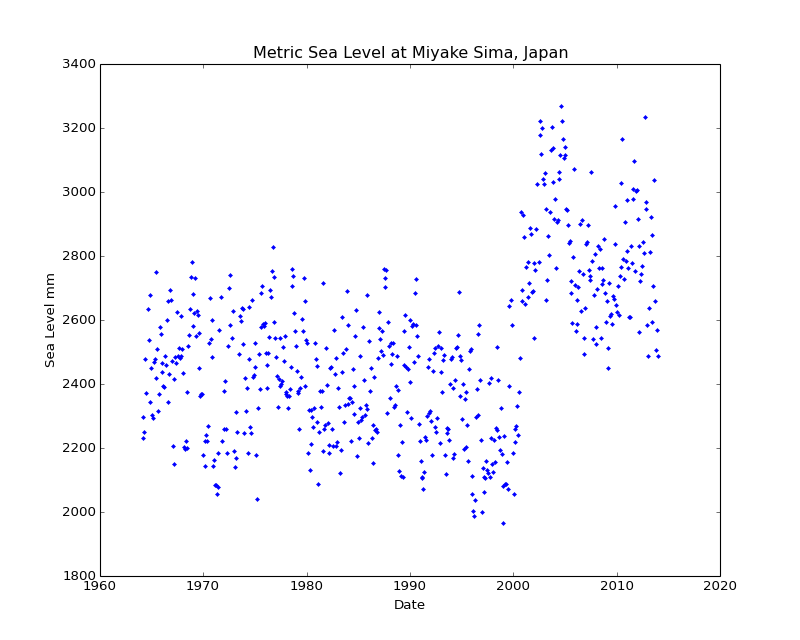
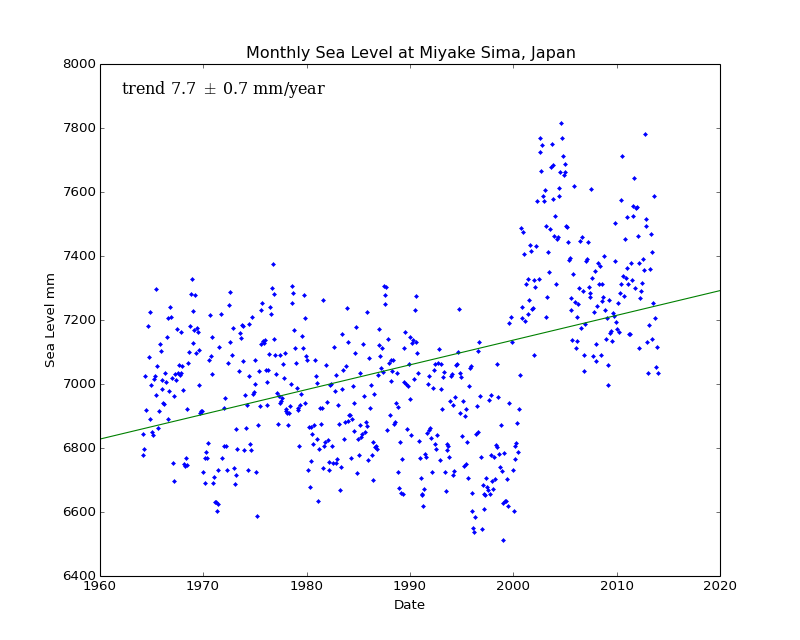
Miyake Sima, Japan is a case where adjustments just seem to shift all the data vertically by the same amount
unadjusted
adjusted
but clearly something happened around 2000. Here is the description from PSMSL
=========================== BENCHMARK INFORMATION UPDATE ADDED 12-JUL-93 :
Miyake Sima 642/098 RLR(1969) is 9.7m below BM Miyake Sima
=========================== FOLLOWING PSMSL DOCUMENTATION ADDED 2002Oct22 :
Data fro 1996-2001 received from University of Hawaii.
The elevated mean levels of 9/2000-12/2001 are due to
island sinking as a result of the volcanic eruption
of Oyama during 6-8/2000.
=========================== FOLLOWING PSMSL DOCUMENTATION ADDED 06-Mar-2008 :
Data 2001 onwards flagged as there appears to a sudden rise in the
dataset.
=========================== FOLLOWING PSMSL DOCUMENTATION ADDED 21-Feb-2012 :
A massive earthquake magnitude 9.0 occurred at 14.46 JST (05.46 UTC) on Friday
11th March 2011 with the epicentre approx. 70km east of the Oshika Peninsula of
Tohoku. It was the most powerful known earthquake to hit Japan triggering a
tsunami with waves up to 40.5m and travelling up to 10km inland.
To repeat what I said at the beginning neither I or PSMSL have made any adjustment for land movement. What has been presented here should be regarded as a first step.
Despite that do you see any sign of the global rate of sea level rise jumping to 3mm/year in 1993?
According to IPCC climate change/global warming should cause an acceleration in rate of sea level rise. Despite hype in media IPCC attribute most (say at least 70%) of sea level rise to thermal expansion of existing sea water.
So if there is no sign of acceleration in the rate of sea level rise – presumably there is no or negligible warming. And if there were falls in sea levels this would be a sign of global cooling.


